|
Introducing support added for debugging dsPIC33CH devices for both the master and slave cores to the CCS C Compiler and IDE using the CCS ICD-U80 or ICD-U64 device programmers. This support will be available starting with Compiler version 5.094 and ICD firmware version 3.42 and newer. In addition to debugging the slave core with the CCS tools the slave core can also be programmed starting with the previously mentioned version. Both of these features will aid in developing code for the dsPIC33CH dual core devices.
When debugging there are three setups that can be done. First debug only the master core, second debug only the slave core, or third debug both the master and slave core at the same time. When debugging the slave core the master core's configuration bit need to be set so that the slave core can be debugged. At minimum the S1_ISOLAT, S1_DEBUG and S1_ICSPx, x being the debug pin to use for the slave core, should be set. The S1_ISOLAT configuration fuse allows the slave core to operate even if the master core hasn't set the SLVEN bit in the MSI1CON register, enabling the slave core to run, the S1_DEBUG configuration fuse enables the slave core debugger and the S1_ICSPx configuration fuses sets which S1MCLRx, S1PGCx and S1PGDx pins are being used to debug the slave core.
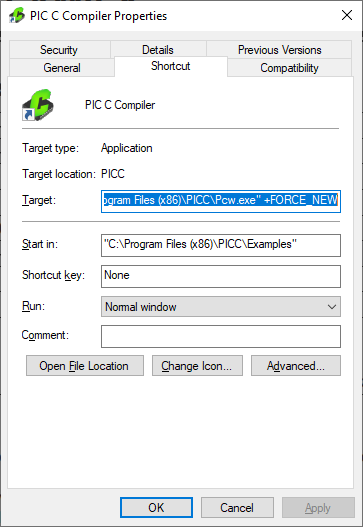
When debugging both the master core and slave core at the same time it requires that two instances of the CCS C Compiler and IDE be running, two device programmers, and the development board will have to have two ICD connectors on it connected to different MCLR, PGC and PGD pins, one for the master core and one for the slave core. To run two instances of the CCS C Compiler and IDE +FORCE_NEW needs added to the target line of the icon used to launch the IDE, for example:

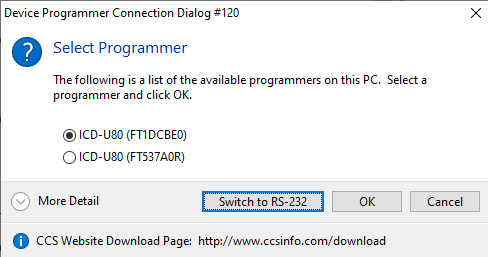
With the above change when using that icon to start the IDE will cause a new instance of the IDE to start allowing for more the one instance to be running. Once there are two instances of the IDE running the master core project should being opened in one and the salve core project should be opened in the other. Next starting with the master core project, build it with the appropriate slave core configuration fuses set and start the debugger. Assuming both ICDs are connected to the PC a selection box similar to the following should pop up:

Select the ICD that is connected to the master core's programming/debugging pins and select 'OK'. If you're not sure which ICD is connected to the master core you may want to disconnect the ICD connect to the slave core debugging pins from the PC and then start the master core's debugger, then when the master core's debugger is loaded the slave core ICD can be reconnected to the PC. Once the master code program debugger is loaded, switch to the CCS IDE instance with the slave core project, build it and start its debugger. Once it's done loading both the master and slave core can be debugged at the same time.
One thing to be aware of the master code debugger using the MCLR pin of the PIC. If the master core's debugger pulls that pin low to reset the master core it will also reset the slave core. So if the master core debugger is reset or the program if reloaded when the slave core is also being debugged, the slave core's debugger needs to be reset to synchronize it with the slave core.
|