

Debugger Features
The C-Aware IDE Compilers include a high level Debugger for Microchip PIC® MCU and dsPIC® DSC microcontrollers. Debug easily at the C level with: Development Boards containing a Flash PIC® MCU series microcrontroller (PIC12F or higher) and a Programmer/Debugger such as: ICD-U64, ICD-U80, Mach X, or Microchip MPLAB® REAL ICE, or ICD3.
- Overview
- RAM
- ROM
- Data EE
- Breaks
- Stack
- Watches
- Peripherals
- Eval
- Monitor
- Break Log
- RTOS Tasks
- SFR
- Debug Configure

for more info
Debugger Overview
Using a debugger tool (CCS ICD, CCS LOAD-n-GO, CCS Mach X, etc), allows the user to debug an application on the microcontroller.
At the top of all debugger windows are action buttons, for performing actions such as run, halt, single step, etc. These are detailed below. Each tab of the debugger window focuses on one function (viewing ROM, viewing RAM, setting breakpoints, etc).
At the bottom of the window there are some status fields:
- PC - This is the program counter (PC), the program memory address that the microcontroller is currently stopped/halted on.
- W - This is the working register of the microcontroller. If the microcontroller has multiple working registers, then this is the first working register (WREG0 or W0).
- Status - This shows the current status of the debugger tool or debugging on the microcontroller (is the debugger tool loading the program, is the program running, is the program ready but halted, etc).
Debugger Actions
| Enable | Enable the debugger. This will launch the debugger portion of the C-Aware IDE and program the microcontroller in debug mode. | |
| Disable | Disable the debugger. This will close the debugger portion of the C-Aware IDE and disconnect from the microcontroller. | |
| Run | Run the program from the current position. | |
| Reset | Resets the microcontroller to the beginning of its program. | |
| Halt | Stop/halt the program. The program in the microcontroller will be halted, and execution will continue from this point on any Run or Step commands. | |
| Step Into | Perform a single step. When stepping, this will step into a function. | |
| Step Over | Perform a single step. When stepping, this will step over a function. | |
| Run to Cursor | Program will run until it reaches the position of the edit cursor. | |
| Snapshot | Allows recording of various debugging info. Allows the user to choose what information should be recorded as well as where to record it and when to record it. The information that can be recorded includes: current time, project name, PC, debugger status, watches, breaks, RAM values, and more. | |
| Configure | Configure the debugger. | |
| Debug Windows |
Show All
Will open all debug dialog windows and dock them to their previous location Hide All
Will hide all debug dialog windows Reset Debug Windows
Will reset the debug window docking position, size and status back to their defaults. RAM, ROM, Data EE, Breaks, Stack, Watches, Peripherals, Eval, Monitor, Break Log, RTOS Tasks, SFR, Debug Configure
This will open the specified debug dialog window and dock them to their previous location.
|
|
| Help | When pressing the help button on the debugger window, it will bring up help on that particular debugger window. | |
| More Options | Shows more actions related to this debugger window. This is the same menu you get when you right mouse-click on this debugger window. |

RAM
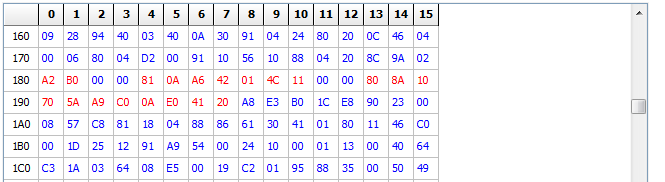
| Debugger Windows - RAM | Display the contents of the microcontrollers data memory (RAM). |
The top row and first column is the address of the cell. In the above example, address 0x16 has the value of 0x8F.
A cell is displayed in red if it's value has changed since the last step/halt, blue if it has not changed.
A value can be changed by double-clicking on the cell and then typing the new value. This will cause the debugger tool to write this new value to the microcontroller.
To read a variable's value, it would be easier to use the Watch window or the Eval window.
Right-click menu
A menu of actions is present by right-clicking in this window
Show as decimal - A tooltip will momentarily display the cell value as unsigned decimal (base 10).
Show as signed - A tooltip will momentarily display the cell value as signed decimal (base 10).
Show as chars - A tooltip will momentarily display the string value (ASCII characters) starting at the current cell and continuing until it hits a null terminator (0x00).
Show as float - A tooltip will momentarily display the floating point representation of the selected cell, by reading the current cell and the next 3 cells and converting it to floating point format.
Copy to notes - Copy the value and save it to the notes file associated with the project.
ROM
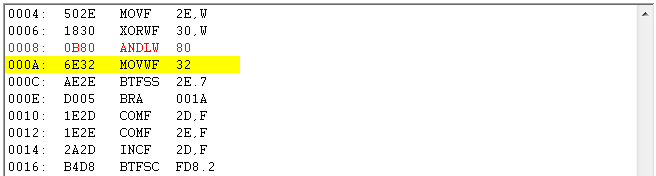
| Debugger Windows - ROM | View the program memory (ROM) of the microcontroller and a dissasembly of that program memory. |
The first column in this window is the physical address of the instruction in program memory. The second is the instruction word for this address. The remaining columns in this window is the dissasembly, or assembly language translation, of this instruction. For more information on the instruction set or assembly language commands for this microcontrller, refer to the documentation and datasheet provided by the microcontroller manufacturer.
The current location of the program is highlighted in yellow.
For a more sophisticated view, showing the C of the program and the generated instruction and assembly for each C line, use the C/ASM list view of the C-Aware IDE. In the C/ASM list you can single step each instruction, and set breakpoints at specific addresses in assembly.
Data EEPROM
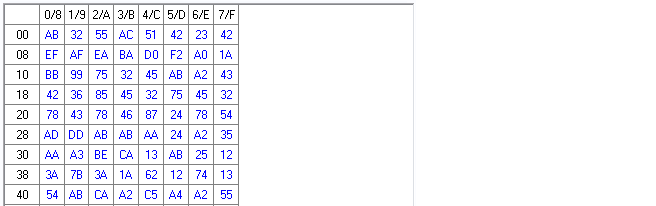
| Debugger Windows - EEPROM | If the microcontroller has internal data EEPROM, this window can be used to read or set the values in that data EEPROM. |
The top row and first column is the address of the cell. In the above example, address 0 has AB stored in it.
A cell is displayed in red if it's value has changed since the last step/halt, blue if it has not changed.
A value can be changed by double-clicking on the cell and then typing the new value. This will cause the debugger tool to write this new value to the microcontroller.
Breaks
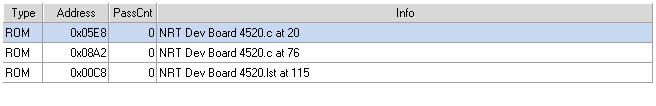
| Debugger Windows - Breakpoints | Configure/set/clear breakpoints, events that cause the microcontroller debugger to halt execution at the point of the event. |
Type - This is the type of breakpoint. ROM breakpoints will break when the execution hits a certain address in program memory. RAM breakpoints will break when the microcontroller core attempts to read or write a specific data memory address. Not all microcontrollers support RAM breakpoints.
Address - This is the address set for the breakpoint. The location of this address depends on the RAM or ROM setting type.
PassCnt - The number of times the address needs to be accessed before the breakpoint will trigger and execution will halt. This is not supported on all microcontrollers.
Info - Some more information about the breakpoint, such as the location in C of the program memory address of which data value of a RAM breakpoint to use.
Stack
| Debugger Windows - Stack | Displays the cal stack of function calls, and all parameters passed to the function. |
Watches
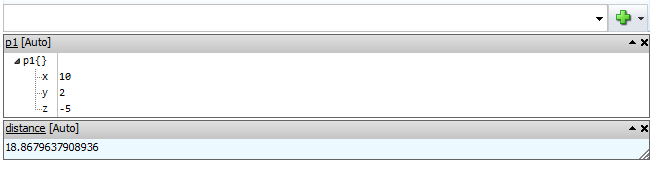
| Debugger Windows - Watches | Watch variables to see their values. |
The field at the top of the window allows the user to enter a variable or expression to be watched. Any valid C expression can be entered. The pull-down can be used to select from a list of all the variables in the program. Pressing enter or pressing the Plus button next to the field will cause the variable or expression to be added to the watch list. The arrow next to the Plus button can be used to add the expression or variable to the watch list, but with modifiers to the formatting or size.
Format - The user can select from several formatting options:
- Auto - The IDE determines the proper format based upon the variable selected.
- Binary - Display in decimal (base 10).
- Char - Display as an ASCII character.
- Hex - Display in hexadecimal (base 16).
- Float - Display as a floating point number.
- String - Display as a string (an array of ASCII characters ending with 0x00 as the null terminator.)
Each variable or expression watched is given it's own table in the window. Clicking on the variable or expression name (which is underlined) allows the user to re-configure this watch (expression, format or size). The description, in brackets after the variable name, details what format and size are being used. Each expression or variable can be minimized or maximized by clicking on the chevron on the right of the table. A variable or expression can be removed from the watch-list by clicking on the X in the right of the table. The boxes or watch list can be re-arranged by hold left-clicking the box title and dragging the box to a new location.
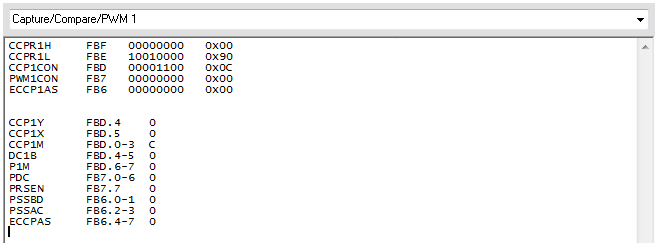
Peripherals
| Debugger Windows - Peripherals | Display special file registers (SFR) of the microcontroller and their values, but categorized by hardware peripherals. |
The pull-down at the top of the window allows the user to select which peripheral to inspect (Analog to Digital Converter, UART, PWM, etc). When a group is selected, the window will show the SFRs related to that peripheral.
The first table shown are all the bytes and words for that peripheral, their location and value. The second table shown are individual bits, their location and value.
For more details about each peripheral, refer to the microcontroller documentation and datasheets.
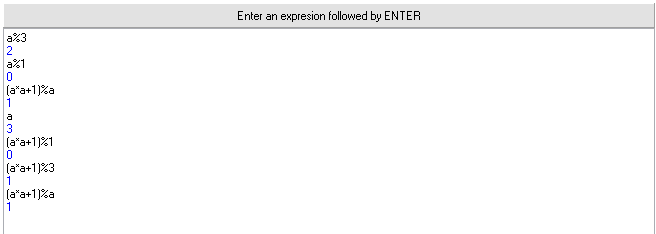
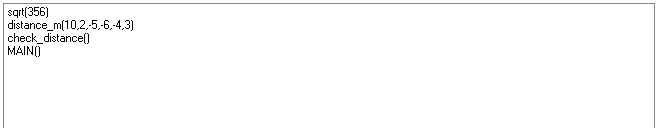
Eval
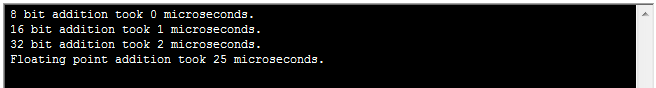
| Debugger Windows - Eval | Use the debugger to evaluate any legal C expression in the user's project, using values and variables stored in memory at the time of execution. |
An expression can be evaluated by typing the expression and then pressing enter. The user expression is displayed in black text, the result displayed in blue text.
Right-click menu
- Keep side effects - Any expressions that include assignment or modification (= operator, ++ operator, -- operator, etc) will actually save that assignment to the data memory of the microcontroller.
- Clear screen - Clear the window.
- Calculator - Open the calculator.
Monitor
| Debugger Windows - Monitor | The ICD connector is 6 pins, but typically only 5 pins are used for programming or debugging as the pin labeled PGM is not used. The Debug Monitor feature of the C-Aware IDE allows the PGM to be used as a 1-wire UART that can operate in conjunction with in-circuit debugging. This is useful for being able to add some debug printf()s and then seeing them inside the debugger window. Although it is 1-wire, it handles data in both directions and getc() can be used in the microcontroller code to receive data from the user. |
General configuration of this feature, including enable/disabling, is done on the Debug Configure window.
Since the 1-wire is bi-directional, clicking the mouse into this window to give it focus and then typing characters on the keyboard will cause those characters to be sent to the microcontroller. The microcontroller can then use getc() or kbhit() to receive that data.
Code does need to be added to the microcontroller to add support - this is done using the #use rs232() preprocessor command, using the DEBUGGER option. Here is example syntax:
#use rs232(DEBUGGER, stream=STREAM_MONITOR, xmit=PIN_B3, rcv=PIN_B3)
- DEBUGGER is required, configures the UART stream to be used as the 1-wire Debug Monitor.
- STREAM configures a unique stream identifier name for this UART, in the event the program has multiple UART streams via multiple #use rs232(). For more information, refer to the #use rs232() documentation in the CCS C Compiler manual.
- XMIT and RCV can be used to configure which pin is being used. If not specified, the compiler uses PIN_B3 as the default. The value for XMIT and RCV must match.
Break Log
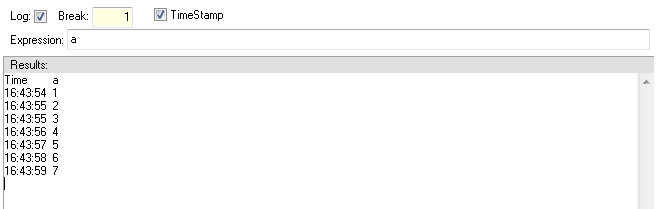
| Debugger Windows - Break Logging | Log a variable's value each time a breakpoint is passed. Unlike traditional breakpoints that halt execution upon the event, a break log will continue the execution. |
Log - If checked, break logging is enabled. When this is checked execution will not be halted when a breakpoint is reached.
Break - If the microcontroller has multiple breakpoints, this field needs to be set to the breakpoint# to use for break logging. See the Breakpoint window for help on setting/removing breakpoints.
Timestamp - If checked, a timestamp will be added to each log entry.
Expression - The variable or list of variables to be logged on each break. The list of variables can be seperated by the ';' character (semicolon).
Results - Each line displays values logged at a breakpoint. If there are multiple values listed in the Expression field, then the values listed in the results field will be displayed in the same order.
Right-click menu
Right clicking in the results area brings up a menu:
Clear Screen - Clear the results display
Save to notes - Save the results display to the notes file associated with the project.
Save to file - Save the results display to a user specified file, the IDE will ask the user what file first.
RTOS Tasks
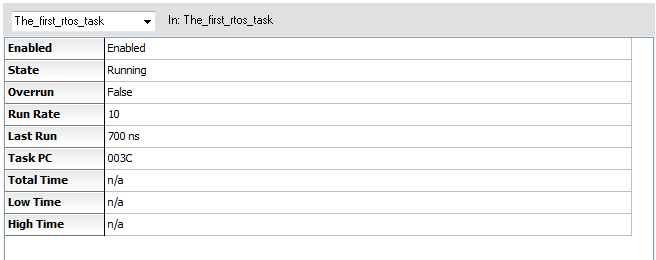
| Debugger Windows - RTOS Tasks | View statistics on all the RTOS tasks running on the target microcontroller being debugged. |
At the top of the window, there is a pull-down that lets the user choose which task to inspect. These are all the functions that are preceded with the #task() preprocessor command.
Next to the pull-down, the 'in' field denotes which task the program is currently in. This is determined by the current program counter (PC).
Enabled - 'Enabled' if the task is enabled, 'Disabled' if the task is disabled. This status is controlled with the rtos_enabled() and rtos_disabled() functions.
State - The state of the task.
- Ready - Task is running normally and waiting for it's next execution time.
- Running - Task is currently executing. Only one task can be running at a time, all others will be disabled or waiting for their time to execute.
- Waiting on await - Task is currently yielded by the rtos_await() function.
- Waiting on semaphore - Task is currently yielded by the rtos_wait() function.
Run Rate - The time between task activations. For example, a task that runs 10 times a second will have 100ms here.
Last Run - How long the task run the last time it was executed.
Task PC - This is the program counter (PC) entry point address of this task. If inspecting the C/ASM List view or the raw program memory, this would be the address this task stars.
Total Time - The total time the microcontroller has spent running this task. This field will not be populated unless the user specifies the STATISTICS option in their #use rtos() preprocessor command.
Low Time - The fastest time it took to execute this task one time. This field will not be populated unless the user specifies the STATISTICS option in their #use rtos() preprocessor command.
High Time - The slowest time it took to execute this task one time. This field will not be populated unless the user specifies the STATISTICS option in their #use rtos() preprocessor command.
SFR
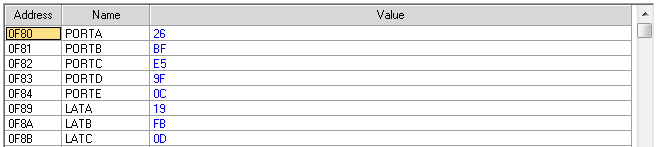
| Debugger Windows - SFR | Show the current values of the special file registers (SFRs), the special control registers of the microcontroller reserved for microcontroller and peripheral status and control. |
Address - The physical RAM address of the SFR.
Name - The name of the SFR, as given and documented by the microcontroller manufacturer.
Value - The current value of that SFR. Values that haven't changed since last halt/single step are in blue, values that have changed are in red. The user can double-click on this field to change the value, at which point it will be written to the microcontroller.
Debug Configure
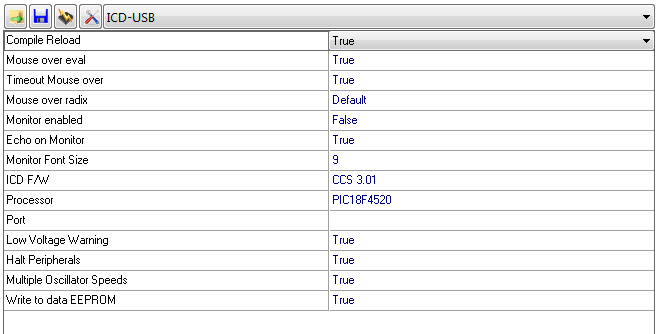
| Debugger Windows - Configure | The icons that are placed on the user toolbars can be added or removed here. |
Compile Reload - If TRUE, the microcontroller will be reprogrammed after every successful compile. If this is FALSE, the user will have to reprogram the microcontroller to load the new program after a compile. This can be done using the program button (
Mouse over eval - If TRUE, the debugger will provide a tooltip hint showing the current value of the identifier if the mouse cursor is hovering over an identifier/variable. This is done by reading the RAM of the microcontroller to get the current value of that identifier/variable.
Timout Mouse over - When FALSE the Move over eval hint (see above paragraph) disappears only if the mouse is moved.
Mouse over radix - Configure the format of the mouse over eval hint (see above paragraphs). The following values are selectable:
- Decimal - All numbers are shown in decimal (base 10).
- Hexadecimal - All numbers are shown in hexadecimal (base 16).
- Default - The debugger uses the data type (char, int8, float, etc) of the variable being displayed to determine if decimal or hexadecimal should be used.
Echo on monitor - If TRUE, an echo of what the user enters into the monitor is echoed on the monitor screen (see above paragraph). More information can be found on the Monitor section of this manual.
Monitor font size - Set the font size for the monitor window of the debugger. More information can be found on the Monitor section of this manual.
ICD F/W - This is the firmware on the ICD or programming/debugging tool.
Processor - This is the microcontroller being debugged.
Port - This is the COM or USB port of the ICD programmer/debugging tool.
Low voltage warning - If TRUE, the debugger will warn the user if the program settings (configuration bits) or the microcontroller are not compatible with 3V programming or debugging. For example, some microcontrollers cannot be fully erased at 3V.
Halt peripherals - If TRUE, the peripherals will be halted/stopped when the debugger halts/stops (for instance, during single stepping or after hitting a breakpoint). The proper setting depends on the application being debugged. Disabling peripherals would be useful for debugging timers, to stop the timer from running while the processor is halted. Disabling peripherals for PWM control of motors or FETs could be disastrous, as it could halt on a high state and let the FET fully drive it's load. Some microcontrollers do not support this feature and force either halting peripherals or running peripherals when halted.
Use external oscillator - If TRUE, the debugger assumes the oscillator clocking the microcontroller clock is fixed and the debugger will not attempt to recalculate the processor speed after every halt or single step. For optimal speed when using an external oscillator, set this to TRUE. If you are using an internal oscillator or a variable speed clock, set this to FALSE so the debugger tool doesn't attempt to communicate faster than the microcontroller can handle.
Write to data EEPROM - If TRUE, the debugger will erase and write to the EEPROM after every program. Set to FALSE to preserve EEPROM contents on each program. Not all microcontrollers support this feature.


