New Features in Version 5
Code Optimizer
Version 5 is the first release to include a very aggressive code optimizer, optimizing for space instead of speed. The new optimizer is able to search the entire compiled program to find repeating blocks of code whereby reducing all those repeating blocks into one shared sub-routine. Optimizer is executed during the final phase of the compile which presents the ability to cross a unit boundary when performing the optimization.
#opt compress: This new optimization level can be achieved by adding this line of code into your project.
The average size reduction of program memory is approximately 15%. In some cases we have seen program memory reduced by 60%. Provided below are examples of compression levels:
| Optimization Level Efficiency | Compiler Versions | ||
| V4.141 | V5.006 | ||
| File / Processor | (Program Memory Bytes) | Reduction % | |
| ex_modbus_master.c PIC16F1937 |
3926 | 3068 | 22.00% |
| ex_j1939.c PIC18F4580 |
7552 | 6166 | 18.00% |
| ex_st_webserver2.c PIC18F4550 + ENC28J60 |
60282 | 52664 | 12.00% |
Improved standardization
CCS C Compiler Version 5 has been updated to follow conventional C standards:
- The .h file for specific PIC® MCU are now prototyped. Now included are prototypes of the compiler's built-in functions and data-types. This is useful for programmers using tools that would have flagged the compiler's built-in functions and data-types with an error because they were not defined.
- A new command-line parameter: sourceline. This now has been added to inject a C source-line into the file being compiled. Usage example:
ccsc.exe +FH myfile.c sourceline="#device PIC16F887" - Standard C libraries iso646.h and stdbool.h have been added.
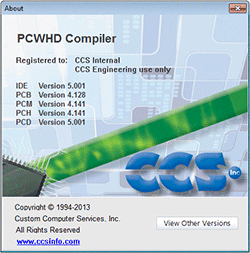
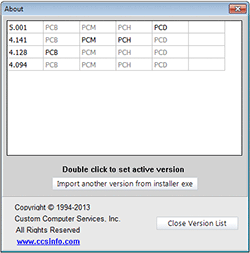
Multiple Compiler Versions
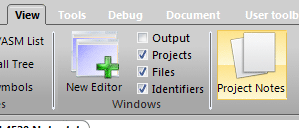
Project Notes
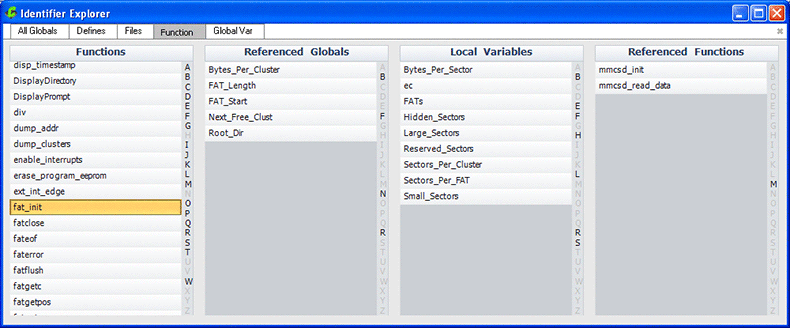
Identifier Explorer
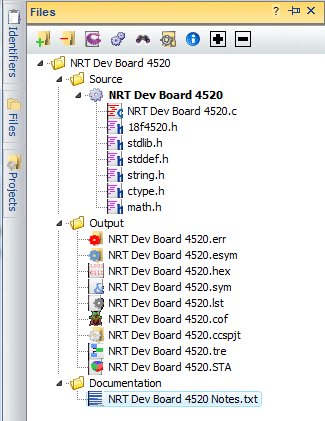
Files navigation panel
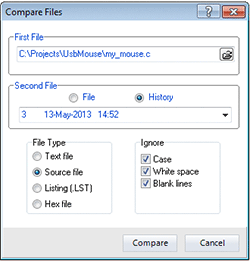
Project History
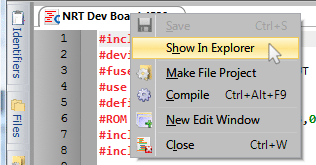
Show in Explorer
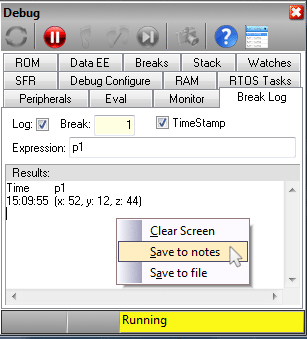
Save to notes
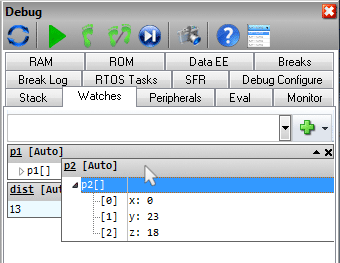
Mouse-over Watch
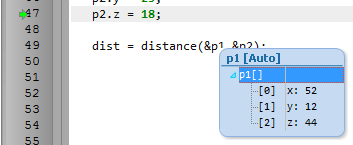
Drag and drop "watch items".
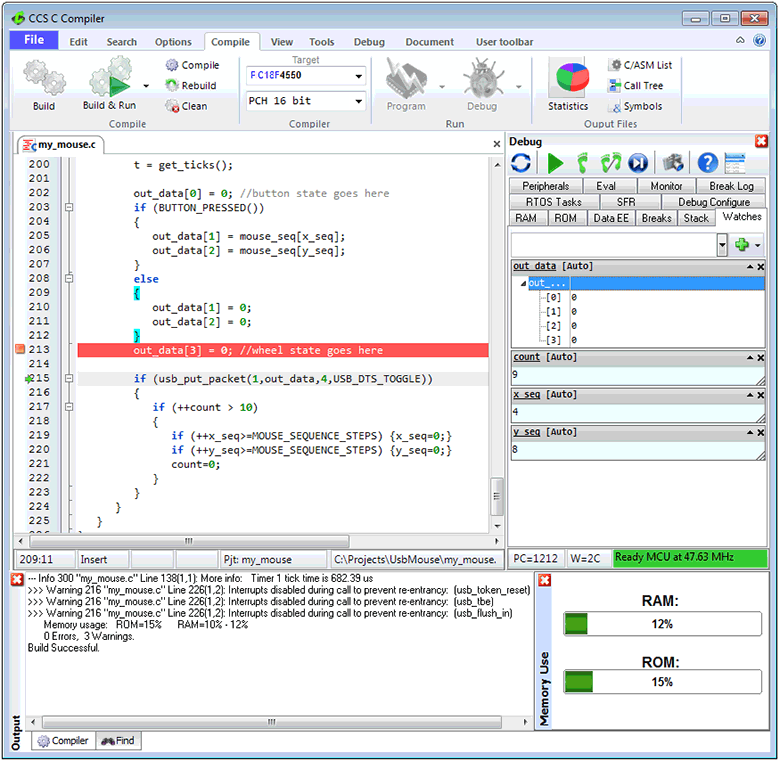
Superbar
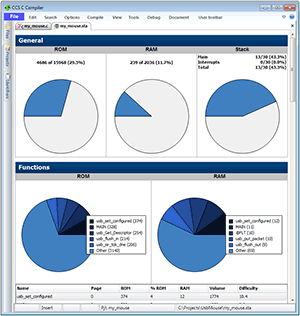
Statistic Viewer
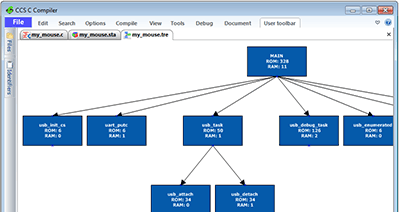
Tree Viewer
Live Syntax Checker

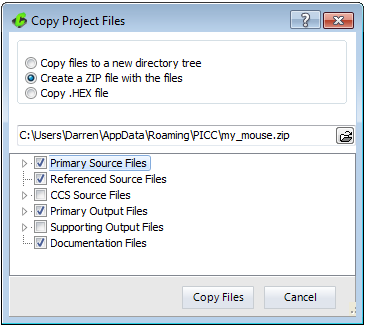
Copy Project Tool
Copy Find and Search Tool
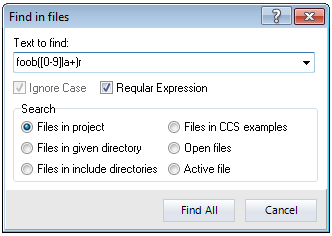
Find Tools

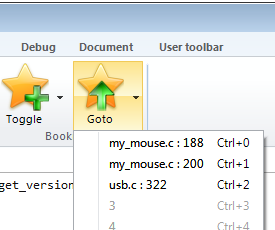
Bookmark Tool
Build and Run Tool

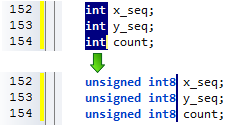
Column Editing
C++ stream operator support
In standard C, basic I/O are handled by functions like getc(), putc() and printf() and the formatting of data is handled by functions like atoi(), atof(), strotul() and sprintf(). For example, reading a floating point number from the user over RS232 would require a combination of gets() followed by atof(). While CCS includes an input.c library that accomplishes many of these tasks, the input.c library uses a fixed RS232 stream and does not work with Keypad/LCD or USB without modification. Starting with V5 of the CCS C Compiler, CCS has added support for the C++ stream operator. C++ streams provided a unified interface for I/O and data formatting.
The two new operators added are the extraction operator and the insertion operator:
| Operator Symbol | Operator Name |
|---|---|
| >> | Extraction |
| << | Insertion |
When used, these operators show the direction of data. For example:
| Example | Comment |
|---|---|
| x >> y | Data read/parsed from x and saved/sent to y. |
| x << y | Data read/parsed from y and saved/sent to x. |
The beauty of these operators is that the x and y in the above examples can be any combination of function, RS232 serial stream, variable, string and more.
One of the key features of this new feature in the CCS C Compiler is the way it automatically handles the conversion based upon the data types of the variables passed. These conversions are done automatically, no other helper functions like atof() need to be called. For example, if a variable is of float type the compiler will properly convert it from string to float on an input or convert float to string on an output.
stream << identifier
stream in the above example can be one of the following:
- cout - maps to the default #use rs232() stream. This provides compatibility for using existing C++ code that explicitly uses the cout stream class.
- RS232 stream name - A stream identified with the stream=x option of #use rs232().
- char array (string) - Data is parsed from identifier and saved to the char array with a null terminator.
- function - A function that takes a char for it's input variable. For example, lcd_putc() in CCS's lcd.c driver or usb_cdc_putc() in CCS's usb_cdc.h driver.
identifier can be can be an int, float, fixed point decimal, int1 (boolean) or char array.
identifier can be any of the following manipulators:
- hex - When converting variable to string, convert it to hex format characters (similar to %x in printf()).
- dec (default) - When converting variable to string, convert it to decimal format characters (similar to %d in printf())
- setprecision(x) - set number of places after the decimal point.
- setw(x) - set number of characters output for numbers
- boolalpha - output int1 as "true" or "false"
- noboolalpha (default) - output int1 as "1" or "0"
- fixed (default) - floating point numbers displayed in decimal format (similar to %f in printf())
- scientific - floating point numbers displayed in E notation (similar to %e in printf())
- iosdefault - all modifiers back to default settings
- endl - output CR/LF
Here is an example usage of this operator:
cout << "Price is $" << setw(4) << setprecision(2) << cost*num << endl;
This example transmits "Price is $" followed by the result of cost*num with two decimal places follwed by the CR/LF. This is transmitted using cout, which is the default RS232 stream.
Here is a change to the above example to display on the LCD using the lcd_putc() function provided in CCS's lcd.c driver:
lcd_putc << "Price is $" << setw(4) << setprecision(2) << cost*num << endl;
Here is a change to the above example to save the formatting to a string variable called result_string:
result_string << "Price is $" << setw(4) << setprecision(2) << cost*num << endl;
stream >> identifier
stream in the above example can be one of the following:
- cin - maps to the default #use rs232() stream. This provides compatibility for using existing C++ code that explicitly uses the cout stream class.
- RS232 stream name - A stream identified with the stream=x option of #use rs232().
- function - A function that returns a char. For example usb_cdc_getc() in CCS's usb_cdc.h driver. This function is called for each character, until a r is received.
identifier can be a variable that is integer, char, char array, float or fixed point integer type. Float type formats can use the E format.
identifier can be any of the following manipulators:
- hex - hex format numbers
- dec (default) - decimal format numbers
- strspace - allow spaces to be input into strings
- nostrspace (default) - spaces terminate string entry
- iosdefault - all manipulators to default settings.
Here is an example of reading a number from the user and saving it to the variable value:
cout << "Enter Number";
cin >> value;
The above example can be quickly modified to read from the USB virtual COM port using the routines in CCS's usb_cdc.h driver:
usb_cdc_putc << "Enter Number";
usb_cdc_getc >> value;
Several values can be read at a time:
cin << variable1 << variable2 << variable3;
In the above example, the input operator would stop reading into variable1 and start reading into variable2 once a character is received that is not valid for that data type. For instance, if variable1 and variable2 are both int, it would stop reading into variable1 and start reading into variable2 upon the reception of any character that isn't "0" to "9", like a space or new-line.
Data conversion from a string to a variable can also be achieved. This example converts the str string variable to the val variable. The type of conversion is determined by the data type of val:
str >> val;
New Input Capture and PWM libraries
CCS has added new #use capture() and #use pwm() libraries that makes it easier to use the PIC® MCU's capture/compare/PWM, input capture and output capture peripherals. One challenge using these peripherals is designing the PWM to operate at a desired frequency and resolution, or configuring the capture peripheral to measure events at a known time duration. Another challenge is that the configuration is generally only valid for certain PIC® MCU families and one oscillator speed; changing the PIC® MCU or the oscillator would mean reviewing and updating the way those peripherals are configured.
CCS's new #use capture() and #use pwm() libraries solve these problems by making it easy to use these peripherals and making the code portable to different PIC® MCUs and oscillator speeds.
The input capture peripheral samples and holds a timer value when the peripheral's input pin reaches the desired level. This peripheral is useful for measuring the time duration between two events.
Here is an example of the new #use capture() library being used to measure the frequency of an input signal:
unsigned int16 GetFrequency(void)
{
The above example shows the API for the new library:
- #use capture() - Configures the input capture peripheral for use. GPIO pin and trigger event can be selected (IC or CCP pin must be used). The timer configuration is also configured, choosing which internal timer to use and what resolution per bit. Not shown in this example is a stream identifier, that allows one program to have multiple #use capture() for multiple pins.
- get_capture_event() - returns TRUE if an event has happened and get_capture_time() needs to be used to read the event. This will return TRUE until get_capture_time() was used to read the event.
- get_capture_time() - reads the last held timing event. The timing resolution returned by this is defined by the #use capture(), and in this example it is CAPTURE_TICKS_PER_SECOND.
In the above example, the capture peripheral and Timer 1 is configured to capture a rising voltage on pin C1 with a 1ms tick per bit resolution. Not every PIC® MCU and oscillator configuration can be configured for a 1ms tick resolution, and thus the define option in #use capture() will #define a literal based upon the final resolution that was achieved by the library. The compiler will also give you an info message detailng the final resolution that was achieved.
Pulse-width modulation (PWM) is the method of pulsing a digital signal on/off to represent an analog signal. A PWM's two properties are it's frequency and duty cycle. A duty cycle is the ratio the digital signal is on versus off.
Here is an example of the CCS #use_pwm() library being used:
void DACSetHalfValue(void)
{
The above example shows the API for the new library:
- #use pwm() - Configure the PWM peripheral for use, configuring the PWM pin, timer and intial starting frequency. Not shown is a stream identifier, allowing multiple #use pwm() to be used in the same program. Not shown is configuring the resolution size of the PWM, for developers who want to use the most bits of resolution of duty cycle but at lower PWM frequencies.
- pwm_on() - dynamically turn on the PWM. pwm_off() is also available to turn of the PWM.
- pwm_set_frequency() - set a new frequency, in Hz.
- pwm_set_duty_percent() - set a new duty cycle, parameter is in tenths percent.
The #use pwm() allows the user to configure the PWM based on a desired frequency, a desired resolution, or a combination of both. Depending on the PIC® MCU and oscilliator it isn't always possible to reach the desired frequency, the compiler will give you an info message detailing the final frequency.
Using V5 to add flow control and buffering to your serial routines
CCS's powerful #use rs232() library has now added transmit buffering, receive buffering and flow control. API for the serial library remains unchanged (getc(), putc(), printf()), existing code that uses this API can add buffering and flow control by simply changing the #use rs232() configuration. By using the new #use rs232() parameters, user can specify: size of transmit buffer, size of receive buffer, interrupt usage or no interrupt usage, pin for CTS and pin for RTS.
Let's review a usage example of using the #use rs232() without flow control or buffering:
void Transaction(char *pString)
{
The code above has two problems:
- The printf() will transmit the pString to the receiving unit with no delays or consideration of the recevieng unit's ability to read the transmission. If the receiving unit is busy or not able to handle the transmission then the transaction would be comprimised.
- Between the prinf() for transmission and the kbhit()/getc() for reception, there is a large delay (500ms). If the receiving unit had sent it's response before the 500ms delay expired then it would be likely that our Transaction() routine would miss that response.
By using buffering and flow control, both problems above can be avoided. Here is an update to the above code, this time using CCS C Compiler's V5 new #use rs232() features:
void Transaction(char *pString)
{
First thing to note about the updated example is that the only code that changed is the #use rs232() line for configuring the UART. The printf(), kbhit() and getc() didn't need to be changed. This shows how easy it is to take existing code and adapt it to use buffering or flow control. The buffering options can be used without flow control.
Here is an overview of some of the new #use rs232() options shown in the above example:
- RTS - specifies which pin to use for RTS. This pin is output by the PIC® MCU to tell a transmitter to stop transmitting because the receive buffer is getting full. There is also another option, RTS_LEVEL, that can be used to configured if high or low level is asserted.
- CTS - specifies which pin to use for CTS. This pin is read by the PIC® MCU to determine if the receiving unit can handle a reception. If this pin is asserted, printf()/putc() will put data into the transmit buffer. There is also another option, CTS_LEVEL, that can be used to configured if high or low level is asserted.
- RECEIVE_BUFFER and TRANSMIT_BUFFER - configure the size of the receive and transmit buffers, respectively.
- TXISR - When specified, the #use rs232() library will use the TBE (transmit buffer empty) ISR to send data when the PIC® MCU's EUSART peripheral is ready. This option can only be used when using a hardware EUSART peripheral. TXNOISR option can also be used, when used putc()/printf() will poll the TBE flag to determine if a transmit can be used. This is detailed below.
Receive buffering always uses an ISR. In order to accomplish this, either a hardware EUSART peripheral has to be used or the RX pin has to be an external interrupt pin. Transmit buffering doesn't have these limitations, any GPIO pin can be used for transmit.
In the above example, calls to printf() will place the data into the transmit buffer and then the RS232 library will push data out of the transmit buffer if CTS pin signifies we are allowed to. The kbhit() returns TRUE if there is data in the receive buffer, and getc() will read the next character out of the receive buffer. The #use rs232() library will automatically control the RTS pin during the receive ISR depending on the remaining size of the buffer.
The RS232 API adds a few new functions related to buffering:
- putc() - when called with no parameters (or just the stream identifier) then it polls the TBE and flow control pins to determine if a character in the transmit buffer needs to be sent.
- xmit_buffer_bytes(), receive_buffer_bytes() - returns the number of bytes in that buffer.
- xmit_buffer_full(), receive_buffer_full() - returns TRUE if the buffer is full.
This only scratches the surface of what the V5 compiler can do in regards to adding buffering and flow control to the serial libraries. There are more configuration and control options that are available. If you have any comments or questions about the serial library upgrades, or V5 in general, please e-mail us!
Timer tick library
CCS has added a new #use_timer() library that makes it easier to use the PIC® MCU PWM and OC peripheral. This new library also makes it easier to port code from different PIC® MCUs or different clock speeds. This new library now handles configuration of timers and prescalars, based on your configuration - automatically! Here is an example:
int1 OneSecondExired(void)
{
#use timer() can be configured for any internal timer. The compiler now provides an information message detailing the final resolution based on the specific PIC® MCU and oscilliator. The define option can also be used to define a run time constant that can be used to determine the resolution per bit. (TICKS_PER_SECOND in the above example).
Once #use timer() is used, that timer is used to create a free standing timer of which get_ticks() can be used to read the current time. #use timer() can also be configured to read from an external clock source, if that PIC® MCU's timer has the capabality.
SPI sharing
Within CCS C Compiler Version 5 we have added the ability for multiple #use spi() streams to share the same SPI peripheral or pins while adding routines that allow you to reconfigure SPI. Here is an example usage of the new features:
unsigned int8 EEPROMRead(unsigned int16 address)
{
NOINIT option in #use_spi() and the spi_init() function are also new features added to CCS C Version 5. The NOINIT option tells the compiler to not initialize the SPI peripheral at the beginning of main(). The spi_init() routine then intializes this SPI stream based upon it's configuration parameters. We have added an optional parameter to spi_init() that allows you to dynamically change the clock rate.
A benefit of these additions allows you to use several SPI devices sharing the same SPI pins or SPI peripheral while each SPI device may have different max clock rates or operate in different SPI modes. By using spi_init(), you can reconfigure the SPI peripheral based upon the configuration of that device before communicating with that device.
pin_select() function
Prior to CCS C Compiler version 5, using a PIC® MCU's peripheral pin-select (or reprogrammable pin) was done via a pre-processor command. For example:
#pin_select U1TX = PIN_D5
The downside to the pre-processor command is that it wasn't dynamic and was always executed at the beginning of main(). With CCS C Compiler version 5, the function pin_select() has been added which now allows for dynamic reconfiguration:
pin_select(U1TX, PIN_D5);
J1939 CAN Driver
A driver added to perform a SAE J1939 data link layer using CAN for the physical layer.
time.h improvements
time.h is the standard C library for reading the current date/time and performing math on date/time variables. Version 5 made improvements the previous version of time.h. The time.h file has been cleaned up to make it easier to adapt existing devices, like real time clocks, for use. The ds1305.c driver has also been added and is now compatible with time.h.
virtual_eeprom.c driver
This driver creates a virtual EEPROM using two pages of program memory (flash). A write balancing algorithm is integrated into this driver to prevent continuous writes to one address from wearing out the endurance of the flash memory.
- input.c driver upgraded to allow editing of existing strings or integers.
- USB driver/library upgraded to allow the creation of a device that contains both CDC and HID interfaces at the same time.
- internal_eeprom.c was added to simplify writing multi byte structures to the internal EEPROM.
The C Profiler 
While the PIC® MCU is running, the C Profiler tool is continuously logging and analyzing run-time events to give a profile of the program. Number of times a function is executed, min/max/average time it takes a function to execute and the program's call sequence are all logged and analyzed. The user can also specify to profile only certain blocks of code, to transmit special debug messages or log certain variables.
The C Profiler can be globally enabled, disabled or configured with one CCS C Compiler statement, #use profile(). For most applications, only one #use profile() command is required to configure an application for the C Profiler tool. There also exists a #profile preprocessor command and profileout() macro to dynamically control the C Profile tool to finely adjust which data and routines you need to profile.
The C Profiler operates while the PIC® MCU is run mode, not while the PIC® MCU is debug mode. The least amount of data is read from the PIC® MCU while running, to keep execution speed high. For example, strings are sent using a one byte identifier instead of the entire string. This is ideal in many scenarious where high execution speed is necessary and a standard ICD debugger cannot be used because of its overhead. USB, for example, is difficult to debug with an ICD because just a few milliseconds of delays can cause USB to not work. USB operation can be debugged with the C Profiler because the overhead is kept minimum.
Statistics
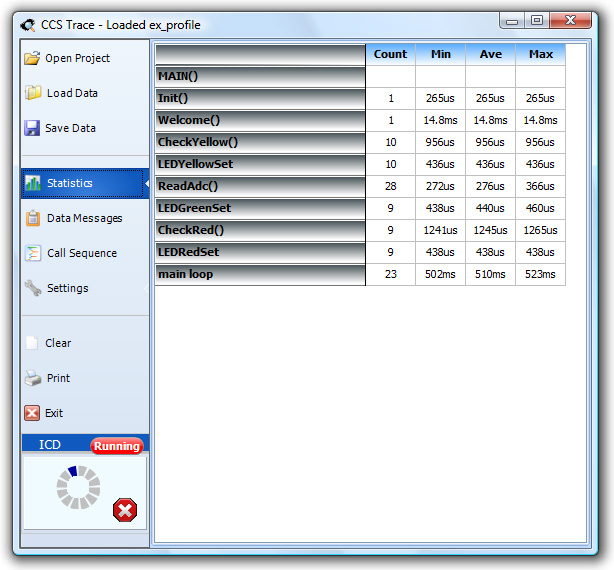
The Statistics view of the C Profiler shows timing information of all the functions in your program, detailing the minimum, maximum and average time each function takes. This is a great way to keep tabs of how long it takes your program or branches of your program to execute. This will also be helpful to programmers developing a cooperative multitasking scheme, and specific timing needs need to be kept by the program.
For large applications with lots of functions it might not be ideal to log each function, but rather only log specific functions. The C Profile logging can be dynamically turned off and on with a few pre-processor commands at the source code level:
void FunctionNotLogged(void)
{
/* code */
}
#profile ON
It is also possible to track the timing of a specific block of code instead of a function. This can be done with a special profileout() macro. profileout() are disabled if #use profile() is not enabled in your application. Here is an example of using profileout() to track the timing of several functions:
Function1();
Function2();
Function3();
profileout("stop main loop")
When using profileout() like the above example, "main loop" will be displayed in the Statistics window of the C Profile tool.
Trace profiling requires a CCS ICD-U64 to receive the Trace profile messages sent by the PIC® MCU. The PIC® MCU is executing in run mode, not debug mode, so the PIC® MCU will execute normally if the ICD is not connected.
Messages
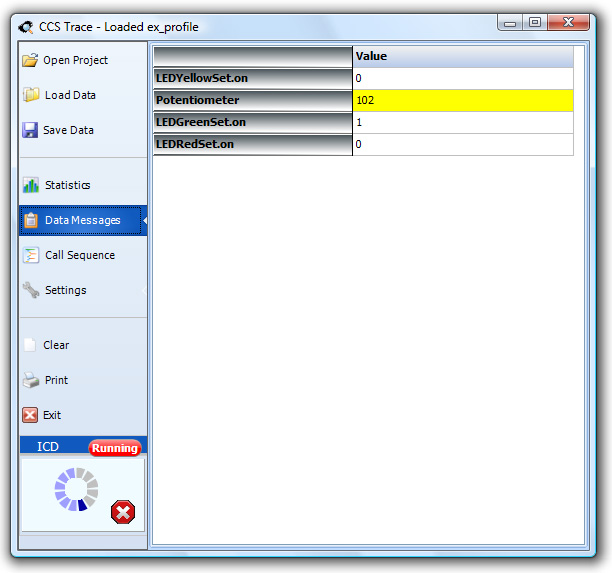
The Data Messages view of the C Profiler tool captures all debug messages sent by your program. Recent messages or changes are highlighted in yellow. These are messages sent by using the profileout() macro. Here are some valid synytax for usage:
profileout("string", value)
profileout(value)
In the above image, the following code was used:
It is important to reiterate that the C Profiler tool does not send the actual string, instead it uses a one byte identifier tag to keep the execution time and overhead low.
Call Sequence
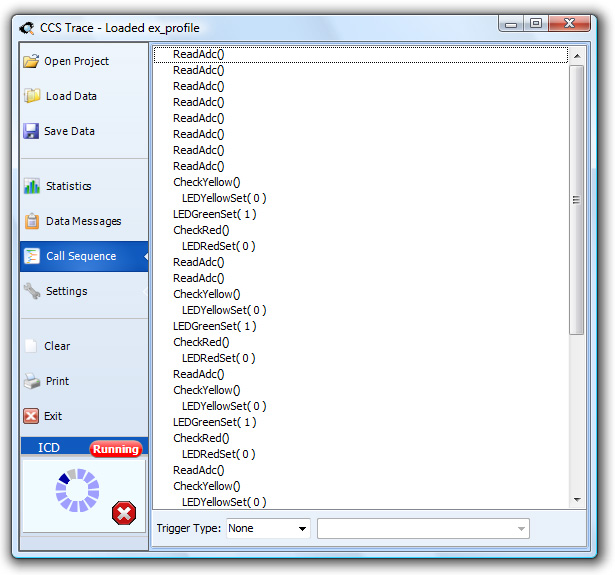
The Call Sequence view of the C Profiler tool shows the execution path of the program being profiled. By inspecting the parameters passed to each function, this view can be used to debug the reason certain parts of a program are executing.
Since a large program may have many functions, it is important to reiterate that #trace off and #trace on can be used to dynamically control which routines are profiled to reduce the amount of data received.
The Call Sequence view also has a means of triggering or filtering the data based on certain conditions. The Trigger Types are:
- None - all received data is displayed.
- Freeze - the display is stopped when the specified function is executed.
- One Shot - display is stopped until specified function is executed.
- Continuous - display is cleared when specified function is executed.
- Accumulate - highlights any differences in the calling sequence of the specified function.
Debug without debugging!
The C Profiler tool is an excellent tool to debug a program without the overhead of using an ICD. The C Profiler requires the CCS C Compiler V5 and a CCS ICD-U64 programmer. If you have any comments about the C Profiler tool or the CCS C Compiler V5, please e-mail us!


