 |
 |
| View previous topic :: View next topic |
| Author |
Message |
exodia505
Joined: 07 Feb 2012
Posts: 34


|
| Graphic LCD |
 Posted: Thu Mar 08, 2012 4:08 pm Posted: Thu Mar 08, 2012 4:08 pm |
 |
|
Hello !
I would like to know a method that can help me to plot a graph of 4 parameters (current , voltage, pression , temperature) (read from adc )
using graphics driver. I use pic 18f4550 and Graphic lcd (128*64).
I use this function "GLCD_pixel" to draw simple function like (sinus). It works fine, but when I use it to draw function like this :y= x²+5;
it will not be fine.
Thanks
_________________
NOway!! |
|
 |
ezflyr
Joined: 25 Oct 2010
Posts: 1019
Location: Tewksbury, MA
|
|
| Posted: Thu Mar 08, 2012 9:23 pm |
|
|
Hi,
I don't think you could have been any more vague in your problem description if you tried. We aren't mind readers, what exactly is not working when you try to graph your function?
A GLCD display is nothing more than a glorified piece of electronic graph paper with individually addressable pixels. Fundamentally they aren't that difficult to use if you've got a working driver. Have you examined the range of x and y? Do they make sense? Are the values compatible with the display area of your GLCD?
What display are you using with this project? Can you draw lines, circles and rectangles?
John |
|
|
exodia505
Joined: 07 Feb 2012
Posts: 34
|
|
| Posted: Fri Mar 09, 2012 4:31 am |
|
|
yes, i can draw text , rect, circles, ...etc , but what i wanted to say is that when i draw a function like this y=x²+1 ; i get just not clear graph scattered points , so how to draw a continues graph ????
_________________
NOway!! |
|
|
ezflyr
Joined: 25 Oct 2010
Posts: 1019
Location: Tewksbury, MA
|
|
| Posted: Fri Mar 09, 2012 8:40 am |
|
|
Hi,
You seem pretty reluctant to provide any specific details about the display you are using, or the exact nature of your problem, so I'm not going to waste any more time playing "twenty questions" with you. Guessing what you are actually using, and trying to do, is not very productive.
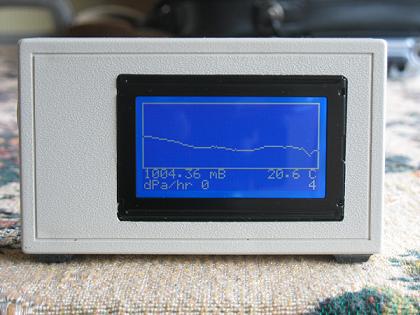
I've done many projects with graphical LCD's, and they've all been pretty straight-forward. I just finished a barometric pressure monitoring system with a graphical display of pressure, and there was nothing special about the coding.
There is a lot out there on the web about GLCD's, so I guess you'll just have to find it!
Good Luck!
John |
|
|
Ttelmah
Joined: 11 Mar 2010
Posts: 19506
|
|
| Posted: Fri Mar 09, 2012 9:16 am |
|
|
I think the obvious 'hint', is what would happen if to draw a rectangle, you just set the four corner pixels. Conversely what happens if you draw lines between these points?.
Best Wishes |
|
|
exodia505
Joined: 07 Feb 2012
Posts: 34
|
|
| Posted: Sat Mar 10, 2012 3:04 pm |
|
|
i want to draw a signal like this one
so, what function will be used "GLCD_pixel " or what ?
_________________
NOway!! |
|
|
dezso
Joined: 04 Mar 2010
Posts: 102
|
|
| Posted: Sun Mar 11, 2012 12:29 am |
|
|
| Quote: | exodia505
y= x²+5; |
Let say you have 50 pixel space
1^2=1
2^2=4
3^2=9
....
....
7^2=49 //at this point you have reached your max y limit !!
....
....
10^2=100 //there is no place to draw this pixel !!
you only got 0-7=8 variable to display !!
You have to find a way to scale your input value to match your display Y space, simple divide math input/50.
Also as Ttelmah suggested, use the DrawLine function (x1,y1)-(x2,y2), now the next line will start from the current x2,y2 and new end point x3,y3.....
_________________
I'm could be wrong many time's, at least I know what I'm doing  |
|
|
dezso
Joined: 04 Mar 2010
Posts: 102
|
|
| Posted: Sun Mar 11, 2012 2:06 am |
|
|
Try this !!!
| Code: | #include <main.h>
#include <HDM64GS12.c>
#include <graphics.c>
char voltText[] = "Volts";
void drawFrame(x,y,w,h)
{
int i=0;
glcd_rect(x, y, w, h, NO, ON); // Outline the frame
glcd_text57(48, 57, voltText, 1, ON); // Display "Volts"
for (i=5;i<=w;i+=10) // Draw some fancy markers :)
{ // horizontal
glcd_line(i,h,i,h+5,ON); // every 10 pixel
}
for(i=y; i<=h;i+=10) // vertical
{
glcd_line(1,i,5,i,ON);
}
}
void main()
{
int ADC_temp = 0;
int x1 = 6;
int x2 = 6;
int y1 = 0;
int y2 = 0;
setup_adc_ports(ALL_ANALOG); // All analog on PORT_A
setup_adc(ADC_CLOCK_INTERNAL); // Internal clock for ADC
set_adc_channel(0); // CH0
glcd_init(ON); // Must initialize the LCD
drawFrame(5,0,125,51); // Draw Plot Frame
while(true)
{
ADC_temp = READ_ADC();
delay_ms(50); // Wait for ADC
y1 = ADC_temp/5; // ADC set for 8 bit / 5 "255/5 max is 51
y1 = 51 - y1;
if(x1 < 124)
{
glcd_line(x1,1,x1,49,OFF); // Erase previous drawing
//glcd_pixel(x1, y1, ON); // use this for slow changing values
glcd_line(x1, y1, x2, y2, ON); // use this for fast changing values
x2 = x1; // x2 now the old coordinate of x1
y2 = y1; // y2 now is the old coordinate of y1
x1++; // move left one pixel
}
else // riched the end, reset x1 and x2
{
x1 = 6;
x2 = 5;
}
}
}
|

_________________
I'm could be wrong many time's, at least I know what I'm doing |
|
|
exodia505
Joined: 07 Feb 2012
Posts: 34
|
|
| Posted: Mon Mar 12, 2012 9:58 am |
|
|
Thank you so much!!
that's what i wanted to do !!
i will try to do it with 4 or 6 adc values.
_________________
NOway!! |
|
|
dezso
Joined: 04 Mar 2010
Posts: 102
|
|
| Posted: Mon Mar 12, 2012 10:12 am |
|
|
4 or 6 separate line will make the plot unreadable !
A- get a much higher resolution display !
B- have it on a separate routine and display it individually
_________________
I'm could be wrong many time's, at least I know what I'm doing |
|
|
|
|
You cannot post new topics in this forum
You cannot reply to topics in this forum
You cannot edit your posts in this forum
You cannot delete your posts in this forum
You cannot vote in polls in this forum
|
Powered by phpBB © 2001, 2005 phpBB Group
|

